The Danish industrial cleaning equipment giant Nilfisk (Lickey) published the 2018 annual report, I simply extracted some for your reference.
2018 annual sales of 1.054 billion euros, operating profit increased by 11.5% compared to 2017 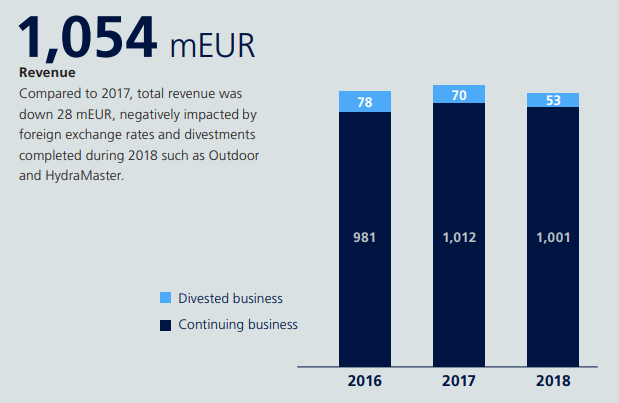

Split the 5 parts out in 2017:
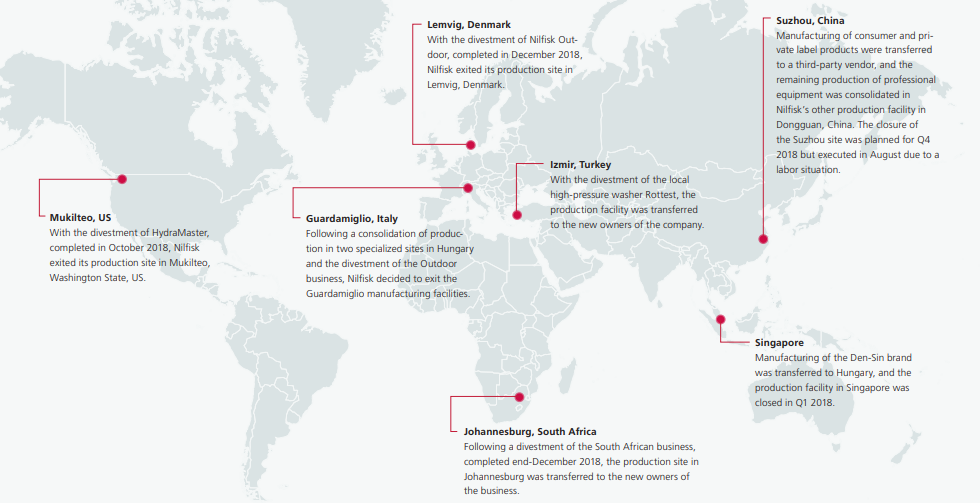
Noridic Chemical & Utensils with an annual output value of around 10 million Euros
Nilfisk South Africa has an annual production value of around 13 million euros
Turkey’s local high-pressure cleaner manufacturer Rottest, with an annual output value of about 1 million euros
American carpet cleaning business, Hydramaster, with an annual output value of 15 million euros
Nilfisk Outdook (outdoor business). The annual output value is 35 million euros.
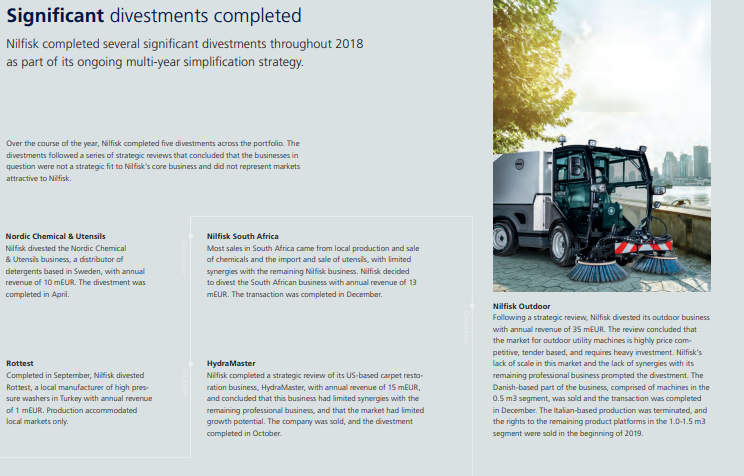
Closed 7 factories:US Mukilteo factory () Hydramaster business), Italy’s Guardamiglio factory (outdoor products business), Turkey Izmir factory (pressure washer), South Africa’s Johannesburg factory, China’s Suzhou factory business transferred to Dongguan, Singapore Den-sin factory.
In 2018, the sales amount was 1,054.3 million euros, in 2017 it was 1,081.9 million euros, in 2016 it was 1,058.5 million euros, in 2015 it was 980 million euros, and in 2014 it was 917.6 million euros.

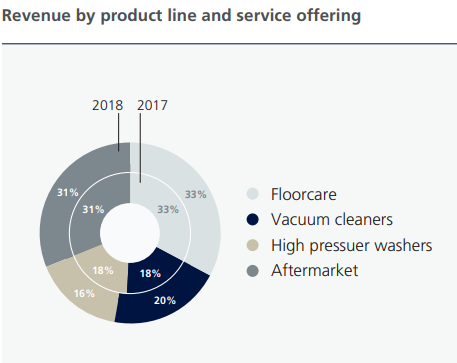
Sales by product:
Floor Care is about 347.6 million euros, 33%, vacuum cleaners, 207.6 million euros, about 20%, high pressure cleaners, 167.6 million euros, about 16%, after-sales market, 331.5 million euros, about 31%.

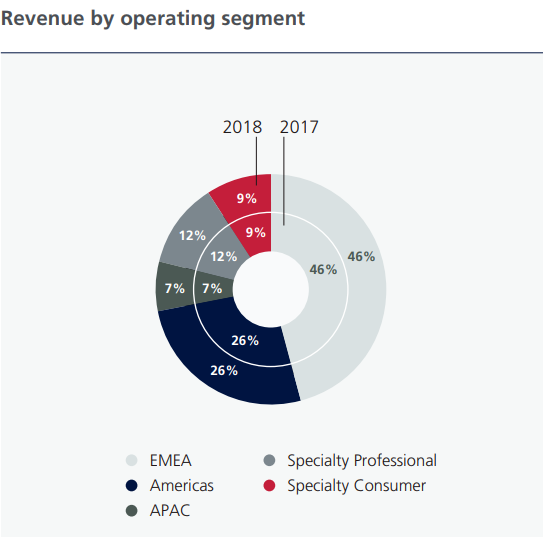
Sales are divided by region:
EMEA 46%, North America 26%, APAC 7%, professional grade products 12%, consumer products 9%.
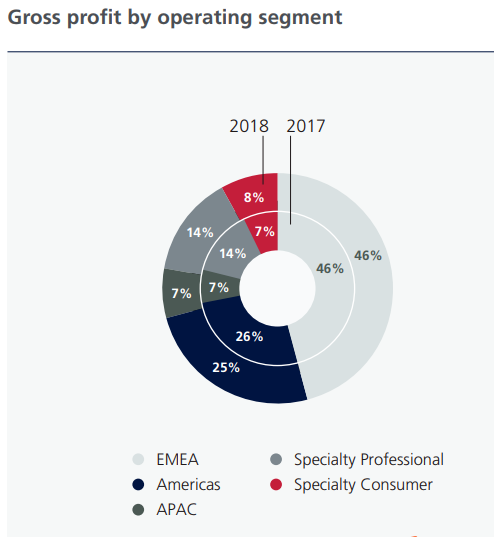
Gross profit margin is divided by region:
EMEA 46%, North America 25%, APAC 7%, Professional Grade 14%, Consumer Grade 8%.

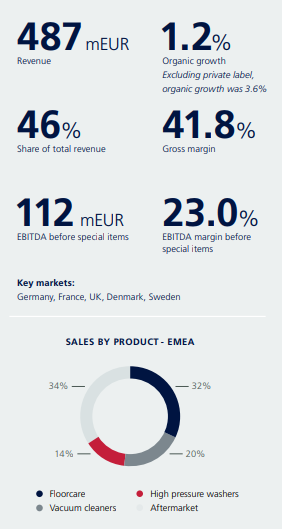
EMEA sales of 487 million euros, natural growth rate of 1.2%, accounting for 46% of total sales, gross margin of 41.8%, core markets: Germany, France, UK, Denmark, Sweden. EMEA regional products sales Floorcare 32%, Vacuum cleaners account for 32%, high pressure cleaners account for 14%, and the aftermarket accounts for 20%.
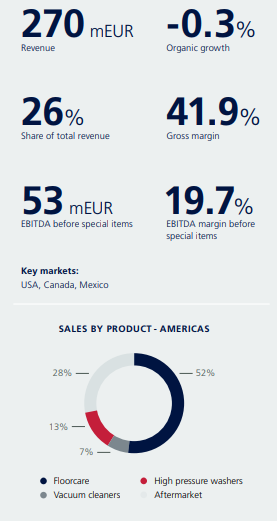
North American regional sales of 270 million euros, natural growth rate of -0.3%, accounting for 26% of total sales, gross margin of 41.9%, core markets: the United States, Canada, Mexico. North America regional products sales Floorcare 52%, vacuum cleaners accounted for 7%, high pressure cleaners accounted for 13%, aftermarket accounted for 28%.
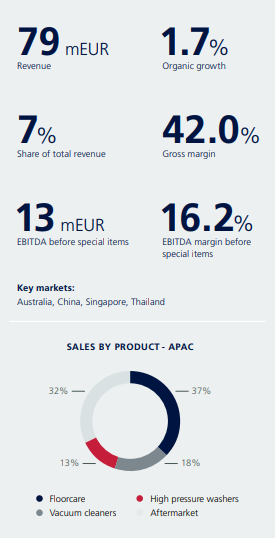
APAC regional sales of 79 million euros, natural growth rate of 1.7%, accounting for 7% of total sales, gross margin of 42%, core markets: Australia, China, Singapore, Thailand. APAC regional products sales Floorcare 37%, vacuum cleaners 18%, high pressure cleaners accounted for 13%, aftermarket accounted for 32%.
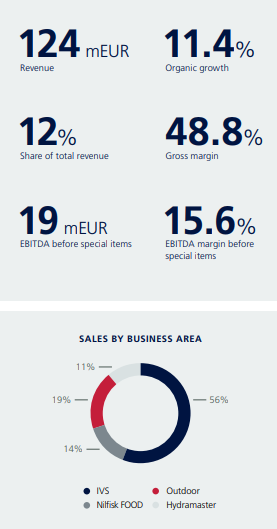
Professional-grade product sales of 124 million euros, natural growth rate of 11.4%, accounting for 12% of total sales, gross margin of 48.8%. Product sales IVS 56%, Nilfisk food 14%, pressure washers 19%, Hydramaster 11%.
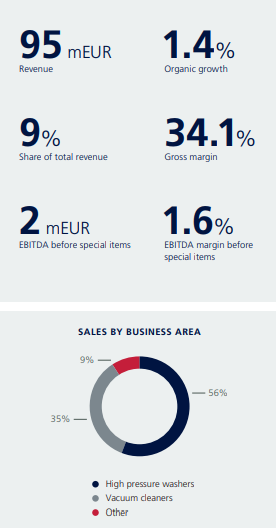
Consumer-grade products had sales of 95 million euros, a natural growth rate of 1.4%, 9% of total sales, and a gross margin of 34.1%. The products sold 56% of high-pressure cleaners, 35% of vacuum cleaners, and others 9%.
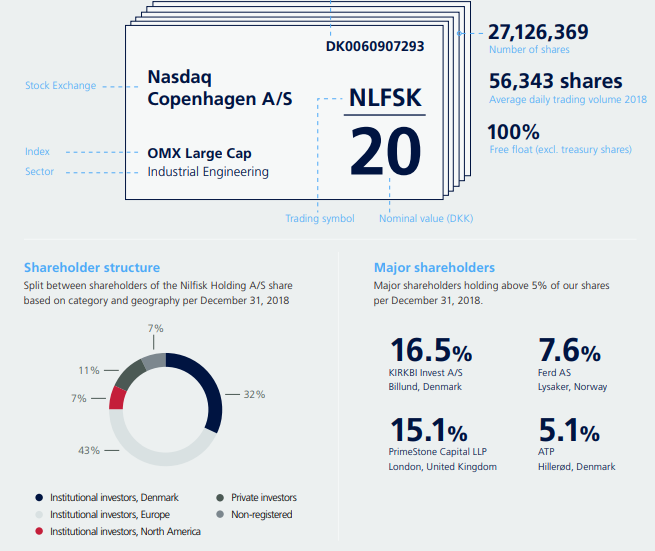
Shareholding structure:
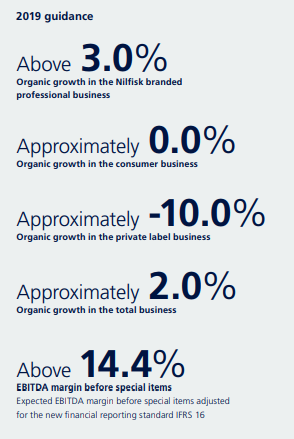
2019 goal:
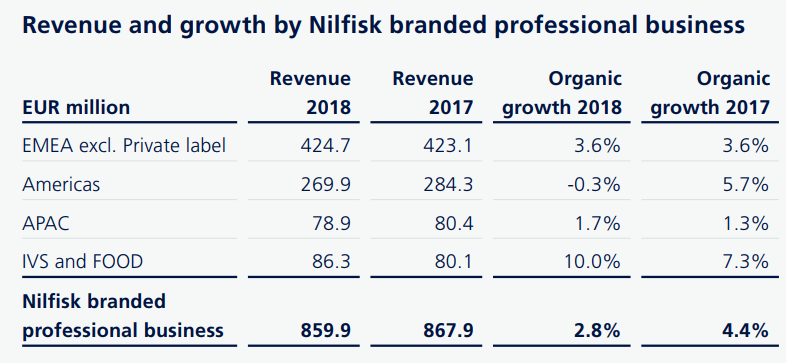
The Nilfisk brand’s professional-grade products naturally grew by 3%, consumer products naturally grew by 0%, Private lable products naturally grew by -10%, total business grew by 2%, and EBITA increased by 14.4%.
